Alright, let’s talk about mean, median, and mode. These are the statistical building blocks that help us make sense of data. Whether you’re a student trying to ace your math class or a professional looking to analyze trends, these three concepts are your best friends. They’re not just math jargon—they’re tools that give you a clearer picture of what your data is really saying. Grasping how they work together can seriously level up your data analysis game.
Now, here’s the thing: understanding mean, median, and mode isn’t just for math nerds. It’s for anyone who wants to decode the numbers in front of them. Each of these measures tells a different story about the data, and when you put them together, you’ve got a powerful toolkit. So, whether you’re crunching numbers for business, science, or even just curiosity, this is stuff you need to know.
In this guide, we’re diving deep into what mean, median, and mode are, how to calculate them, and how they relate to each other. We’ll also cover real-world examples, common mistakes to avoid, and some cool tools to help you analyze data like a pro. By the time you’re done reading, you’ll be ready to tackle any dataset with confidence.
Read also:Unlocking The Power Of Viral Marketing A Stepbystep Guide
Table of Contents
- Breaking Down Mean, Median, and Mode
- How to Calculate Mean, Median, and Mode
- How These Measures Work Together
- Where You’ll Use Them in Real Life
- The Role of Data Distribution
- Symmetry and Skewness: What They Mean for Your Data
- Practical Examples to Illustrate the Connections
- Mistakes to Avoid When Analyzing Data
- Tools to Simplify Your Analysis
- Wrapping It All Up
Breaking Down Mean, Median, and Mode
Before we get into the nitty-gritty, let’s start with the basics. What exactly are mean, median, and mode? Think of them as your data’s best summary stats:
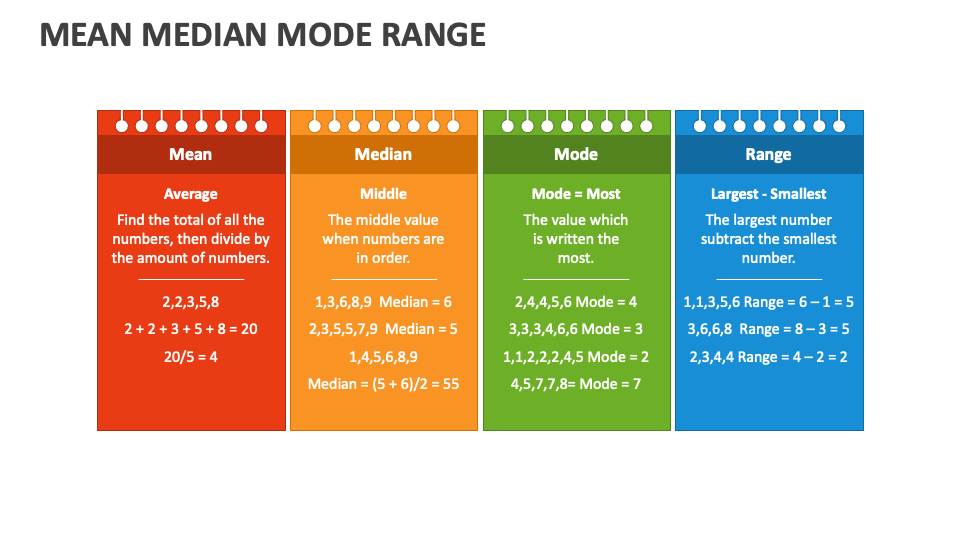
Mean
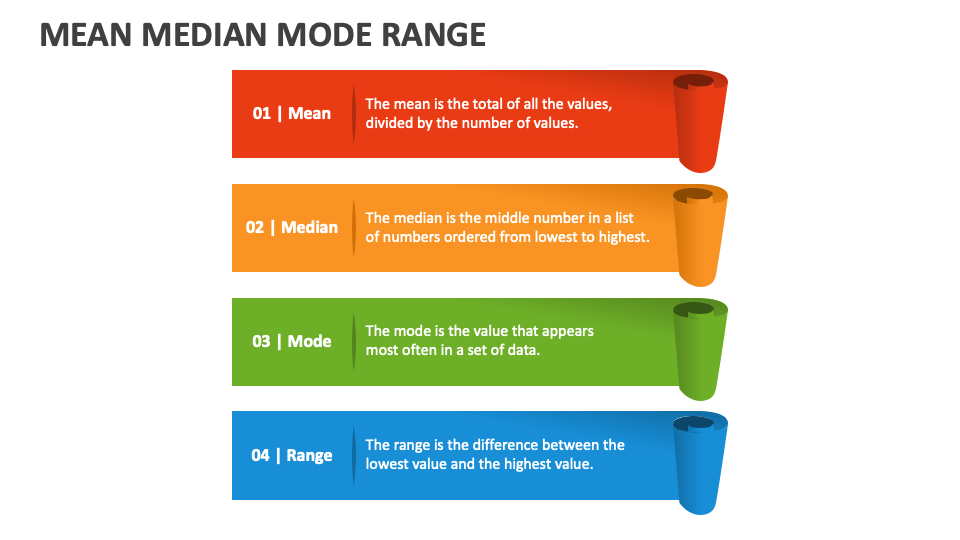
The mean is what most people think of when they hear the word “average.” It’s the total of all the numbers in your dataset, divided by how many numbers there are. For example, if you’ve got the numbers 5, 10, 15, 20, and 25, the mean is (5 + 10 + 15 + 20 + 25) ÷ 5 = 15. But here’s the thing—mean can be thrown off by outliers, those big or small numbers that don’t fit the pattern. So, while it’s a great starting point, it’s not always the full story.
Median
The median is the middle number in a dataset when everything’s lined up in order. If you’ve got an odd number of data points, it’s easy—just pick the one right in the middle. If you’ve got an even number, you take the average of the two middle numbers. For instance, in the dataset 5, 10, 15, 20, 25, the median is 15. In the dataset 5, 10, 15, 20, it’s (10 + 15) ÷ 2 = 12.5. Unlike the mean, the median doesn’t care about those pesky outliers, so it’s often a more reliable measure of the center.
Mode
The mode is the number that shows up the most in your dataset. Sometimes, you’ve got one clear winner, like in the dataset 5, 10, 10, 15, 20, where 10 is the mode. But here’s the twist—sometimes you’ve got more than one mode, or no mode at all if everything shows up the same number of times. Modes are super helpful when you’re dealing with categories, like favorite colors or types of pets.
How to Calculate Mean, Median, and Mode
Alright, now that we know what these terms mean, let’s talk about how to actually calculate them. Don’t worry, it’s easier than it sounds.
Calculating the Mean
To find the mean, follow these simple steps:
Read also:Kanye Wests Rant About Jayzs Kids A Closer Look At Celebrity Parenting
- Add up all the numbers in your dataset.
- Divide that total by how many numbers you’ve got.
For example, take the numbers 5, 10, 15, 20, and 25. Add them together (5 + 10 + 15 + 20 + 25 = 75), then divide by 5 (75 ÷ 5 = 15). There you go, you’ve got your mean!
Calculating the Median
Finding the median is pretty straightforward:
- Arrange all your numbers in order from smallest to largest.
- Find the middle number. If you’ve got an odd number of data points, that’s your median. If you’ve got an even number, take the average of the two middle numbers.
For example, in the dataset 5, 10, 15, 20, 25, the median is 15. In the dataset 5, 10, 15, 20, the median is (10 + 15) ÷ 2 = 12.5.
Calculating the Mode
To find the mode, just look for the number that shows up the most:
- If one number appears more often than the others, that’s your mode.
- If you’ve got multiple numbers that appear the same number of times, you’ve got a multimodal dataset.
For example, in the dataset 5, 10, 10, 15, 20, the mode is 10. Simple, right?
How These Measures Work Together
Now that we’ve got the basics down, let’s talk about how mean, median, and mode relate to each other. These relationships can tell you a lot about your data:
- In a perfectly symmetrical dataset, the mean, median, and mode are all the same. Think of a bell curve—it’s all lined up nicely.
- In a positively skewed dataset, where the tail stretches to the right, the mean is higher than the median, and the mode is the smallest of the three.
- In a negatively skewed dataset, where the tail stretches to the left, the mean is lower than the median, and the mode is the largest of the three.
Understanding these connections helps you see the bigger picture. For example, if the mean and median are way off from each other, you might have some outliers messing with your data. Knowing that can help you interpret your results more accurately.
Where You’ll Use Them in Real Life
So, why does any of this matter? Because mean, median, and mode are everywhere. Let’s look at some real-world examples:
Business Analytics
In business, these measures are gold. Companies use them to analyze everything from sales data to customer demographics. For instance, the median income is often a better indicator of a population’s financial health than the mean income, which can be skewed by a few super-rich individuals.
Education
In schools, teachers use these measures to evaluate student performance. The median score can give a clearer picture of how the class is doing overall, without being thrown off by a few extremely high or low scores.
Healthcare
In healthcare, these measures help analyze patient data. For example, the mode of a dataset showing patient ages might reveal the most common age group needing medical attention. That’s valuable info for planning resources.
The Role of Data Distribution
Data distribution plays a huge role in how mean, median, and mode interact:
- In a normal distribution, where the data is evenly spread out, the mean, median, and mode are all the same. It’s like a perfect balance.
- In a skewed distribution, where the data isn’t evenly spread, the relationships between these measures change. This can give you clues about what’s going on in your data.
Understanding your data’s distribution helps you choose the right measure to analyze it. Sometimes, the mean is the way to go. Other times, the median or mode might give you a clearer picture.
Symmetry and Skewness: What They Mean for Your Data
Symmetry and skewness are key concepts in data analysis. Let’s break them down:
Symmetry
A symmetrical distribution is one where the data is evenly balanced around the center. In these cases, the mean, median, and mode are all equal, making it easier to interpret the data. Think of it like a mirror image—it’s all lined up perfectly.
Skewness
Skewness happens when the data isn’t symmetrical. Positive skewness means the tail stretches to the right, while negative skewness means the tail stretches to the left. This affects how the mean, median, and mode relate to each other, giving you more insights into your dataset.
Practical Examples to Illustrate the Connections
Let’s look at some real-world examples to see how mean, median, and mode work together:
Example 1: Income Analysis
Imagine you’re analyzing household incomes. The mean income might be higher because of a few super-rich individuals, but the median income gives a better sense of what most people are earning. This is why median income is often used in economic reports—it’s less affected by those extreme values.
Example 2: Test Scores
In a classroom, the mode of test scores might show the most common grade, while the median score tells you how the middle student performed. Together, they give you a fuller picture of how the class did overall.
Mistakes to Avoid When Analyzing Data
When working with mean, median, and mode, there are a few common mistakes to watch out for:
- Don’t rely too heavily on the mean without considering how sensitive it is to outliers.
- Don’t ignore the context of the data when interpreting the median. It might not always tell the full story.
- Don’t forget to account for multiple modes in a dataset. Sometimes, there’s more than one number that shows up frequently.
Avoiding these pitfalls will help you make more accurate and meaningful analyses.
Tools to Simplify Your Analysis
Luckily, there are plenty of tools to help you crunch the numbers:
- Excel: A classic for calculating mean, median, and mode, plus it’s great for visualizing your data.
- R and Python: These powerful programming languages are perfect for more complex statistical analyses and data visualizations.
- SPSS: A go-to for social scientists, this software makes analyzing large datasets a breeze.
Using these tools can save you time and help you get more accurate results.
Wrapping It All Up
So, there you have it. Understanding the connections between mean, median, and mode is key to effective data analysis. Each of these measures gives you a different piece of the puzzle, and together, they form a powerful toolkit. By considering factors like data distribution, symmetry, and skewness, you can interpret your data more accurately and make smarter decisions.
We encourage you to take what you’ve learned here and apply it to your own analyses. Share your thoughts and experiences in the comments below, and feel free to explore other articles on our site for even more insights into data analysis and statistics. Happy analyzing!